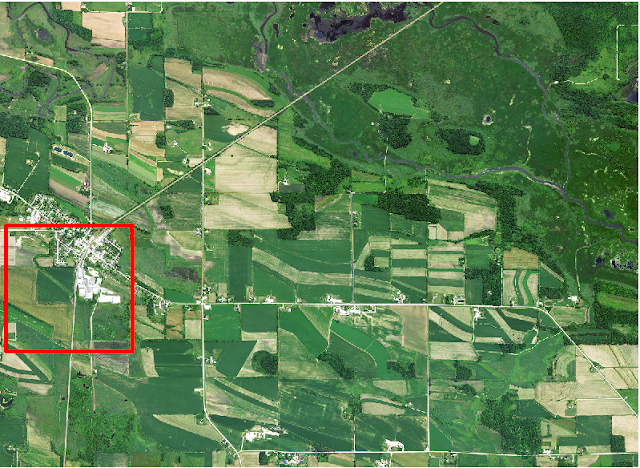
Clipping raster (also known as cropping raster) is used to subset of make your satellite imagery dataset smaller. Raster clipping is done by removing all outside data from crop area (shape file).
In this tutorial I will show you how to clip raster with Rasterio and Fiona in Python
But before start coding let’s make our concept clear to be on the same page with me.
Also Read:
Why to clip raster?
Let’s assume that you have a satellite imagery data covers large area but you want to work for smaller area of that imagery data. In this case you should clip raster by shape file (of the small area you want to work with)
What is shape file?
Shape files stores geometric location and attribute information of geographic features like lines, points or polygons.
Clip raster by shape file is also known as different names in different book or article, sharing those names to feel you comfortable.
· Masking raster by shape file
· Clip raster by shape file
· Clip raster by polygon
· Clip satellite imagery by shape file
· Clip imagery by shape file
· Crop Raster Data With a Shapefile
Now let’s start coding to clip raster in Python. To crop imagery in python, I will use Rasterio and Fiona library of Python.
Course for You: Learn to use Python for Spatial Analysis in ArcGIS
Download imagery and shapefile
As you know to clip imagery you must have two data:
1. Satellite imagery data: You need to have or download satellite imagery data for your analysis area. You can read below article to download high resolution imagery data or you can simply download imagery data I am using for this article.
2. Shape File: You need to have one shapefile for a smaller region (specific area you want to work with) of above imagery.
You can check how I have created shape file for this tutorial by below article. You can create your own shape file or you can simply download shaefile I am using for this article (will share link below)
Note: Download all shape files and keep it in one folder
Install Packages
In this post I will use some libraries to clip imagery in Python
To follow this article you have to install those packages. Listing commands to install those packages.
conda install -c conda-forge fiona
conda install -c conda-forge rasterio
pip install matplotlib
pip install –user geopandas
pip install scipy
Related Post: PythonVirtual Environment Cheat Sheet
Now let’s import all required packages
Import packages
import fiona
import rasterio
import rasterio.mask
from rasterio.plot import show
from rasterio.warp import calculate_default_transform, reproject, Resampling

import geopandas as gpd

import numpy as np
Read Shapefile and Imagery in Python
Hope at this point you have downloaded imagery and Shapefile. Read shapefile using geopandas and read imagery using rasterio.
# Read shape file (created by Las Bound) using geopandas
shape_file = gpd.read_file('input_data/shape_files/lidar_shape.shp')

# Read imagery file downloaded from national map
imagery = rasterio.open("input_data/m_4308842_sw_16_1_20150702_20151109.jp2")
# Plot imagery
show(imagery)
Check projection of Imagery and Shapefile in Python
# Check coordinate reference system (CRS) of both datasets
print('Shape file Projection: ', shape_file.crs)
print('-----------------------------------------')
print('|||||||||||||||||||| Little space |||||||')
print('-----------------------------------------')
print('Imagery file Projection: ', imagery.crs)

Now as you can see projection name of shape file is: NAD83(2011) / WISCRS Dodge and Jefferson (ftUS)

You need to know EPSG value of that projection name. There are various ways to do that, I am sharing one of them.
First go to this site: https://epsg.io
Then click at search button and search for: NAD83(2011) / WISCRS Dodge and Jefferson (ftUS)
At search result you can find EPSG value for our projection name
Which is EPSG:7600
As you already know to work with multiple imagery or LiDAR data, projection system must be same for each data; otherwise we cannot measure or compare anything between two data.
Again if you try to crop imagery for Shapefile and imagery with different projection you will end up with below error in rasterio.
****************************
ValueError: Input shapes do not overlap raster.
****************************
So at this point we cannot clip raster with our shape file as projection systems of two data are different.
Transform projection of imagery to specific coordinate system in Python
So now need to transform projection of any of shape file or imagery file. I found difficulties to transform projection of shape file. So I will change coordinate system of my imagery file. Let’s do that.
# Transform projection of imagery to specific coordinate system

# Specify output projection system
dst_crs = 'EPSG:7600'

# Input imagery file name before transformation
input_imagery_file = 'input_data/m_4308842_sw_16_1_20150702_20151109.jp2'
# Save output imagery file name after transformation
transformed_imagery_file = 'output_data/imagery_trans.tif'

with rasterio.open(input_imagery_file) as imagery:
    transform, width, height = calculate_default_transform(imagery.crs, dst_crs, imagery.width, imagery.height, *imagery.bounds)
    kwargs = imagery.meta.copy()
    kwargs.update({'crs': dst_crs, 'transform': transform, 'width': width, 'height': height})
    with rasterio.open(transformed_imagery_file, 'w', **kwargs) as dst:
        for i in range(1, imagery.count + 1):
            reproject(
                source=rasterio.band(imagery, i),
                destination=rasterio.band(dst, i),
                src_transform=imagery.transform,
                src_crs=imagery.crs,
                dst_transform=transform,
                dst_crs=dst_crs,
                resampling=Resampling.nearest)
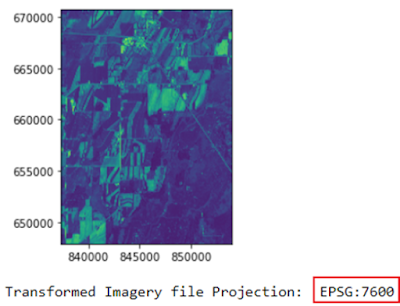
Now let’s plot transformed imagery file and check coordinate system of transformed imagery file.
# Plot again after transformation. You can observe axis value have changed
tr_imagery = rasterio.open("output_data/imagery_trans.tif")
# Plot trasformed imagery
show(tr_imagery)

# Check coordinate reference system of transformed imagery, it's changed or not?
print('Transformed Imagery file Projection: ', tr_imagery.crs)
# tr_imagery.crs

Ohh!! it’s changed successfully.
You can also observe axis value have changed after transforming imagery file.

As projection for imagery and shapefile both are same (EPSG:7600) now.
We can now clip our newly transformed imagery (after transforming projection system) by our shape file generated by Las Bound. Let’s clip it.
Must Read:
- How to Create Boundary Shapefile from LiDAR Data
- Download High Resolution Satellite Imagery Free Online
Clip Raster in Python
Let’s clip imagery In Python with Rasterio and Fiona packages.
# Read Shape file
with fiona.open("input_data/shape_files/lidar_shape.shp", "r") as shapefile:
    shapes = [feature["geometry"] for feature in shapefile]

# read imagery file
with rasterio.open("output_data/imagery_trans.tif") as src:
    out_image, out_transform = rasterio.mask.mask(src, shapes, crop=True)
    out_meta = src.meta

# Save clipped imagery
out_meta.update({"driver": "GTiff",
                 "height": out_image.shape[1],
                 "width": out_image.shape[2],
                 "transform": out_transform})

with rasterio.open("output_data/imagery_trans_clip.tif", "w", **out_meta) as dest:
    dest.write(out_image)
Conclusion
In this tutorial you learned
· Crop Raster using Python (or Crop Imagery using Python)
· Check Projection of shpefile in Python
· Check Projection of imagery in Python
· Change Projection of imagery in Python (or Change coordinate reference system of imagery in Python)
· Plot imagery using Rasterio in Python
· Read shapefile using geopandas
If you have any question or suggestion regarding this topic see you in comment section. I will try my best to answer.
Hey There. I found your blog using msn. This is a very well written article. I’ll be sure to bookmark it and come back to read more of your useful info. Thanks for the post. I will certainly return.