This dash tutorial is an extension of my previous post where I showed you how learn dash using python by spending minimum amount of time. In this post I will concentrate on how to make interactive plots by dash with python.
If you read my last post you will find how to build dash application with python but may have one question in your mind that dash is a python framework to plot plotly dashboard. Now how to use plotly plot codes inside dash.
Also Read:
How to use plotly code inside dash application
import dash
import dash_core_components as dcc
import dash_html_components as html
import pandas as pd
import plotly.express as px

# Import irish dataset
df = px.data.iris()
# Create plotly plot
plotly_fig = px.scatter(df, x="sepal_width", y="sepal_length", color="species",
                 size='petal_length', hover_data=['petal_width'])


app = dash.Dash()
# Dash app layout section
app.layout = html.Div([

    html.H1(children='Use Plotly plot in Dash'),
    html.Div(children='Dash: Python framework to build web application'),

 # Insert plotly plot into dash
    dcc.Graph(id='graph', figure=plotly_fig)
])

if __name__ == '__main__':
    app.run_server(8999,debug=False)
I think now everything to learn dash with python is covered. Now next section is to make interactive plots using dash with python.
Must Read: Learn Dash with Python in 5 minutes
Must Read: Learn Dash with Python in 5 minutes
Make interactive dashboard using dash with python
callback function is used To make interactive dashboards in dash. Below are the steps to follow while making interactive plots using dash with python.
Steps: Callback function has two stages callback class decoder and callback update function.
· callback class decoder
1. Named @app.callback (name should be exactly same).
2. This needs to be defined before callback update function
3. There are two dependencies need to be pass 1) Input 2) Output
4. Inside input dependency required dash core component id with properties need to be passed
5. Inside output dependency also required dash core component id with properties need to be passed
· Callback update function
1. Function to update a specific plots to make interactive (name can be anything)
2. This function should be exactly below to the related callback class decoder
Note: Both of the above function and class needs to be written after the end of dash layout section.
Let’s see the code and output now to understand clearly.
import dash
import dash_core_components as dcc
import dash_html_components as html
import pandas as pd
import plotly.express as px
import plotly.graph_objects as go

# Create plotly plot
plotly_fig = go.Figure(data=[go.Scatter(
    x=[1, 2, 3, 4], y=[10, 11, 12, 13],
    mode='markers',
    marker=dict(
        color=['#ff3300', '#ff3300', '#ff3300', '#ff3300'],
        opacity=[1, 0.8, 0.6, 0.4],
        size=[40, 60, 80, 100],
    )
)])


app = dash.Dash()
# Dash app layout section
app.layout = html.Div([

    html.H1(children='Interactive plot in Dash'),
    html.Div(children='Dash: Python framework to build web application'),

    html.Br(),

    dcc.Dropdown(
  id='test_dropdow1',
  options=[
   {'label': 'Red', 'value': '#ff3300'},
            {'label': 'Green', 'value': '#009933'},
            {'label': 'Blue', 'value': '#0066ff'},
            {'label': 'Yellow', 'value': '#ffff00'}
  ],
  placeholder='Select Color',
  value = 'red',
  ),

 # Insert plotly plot into dash
    dcc.Graph(id='graph', figure=plotly_fig)
])


# Callback class decorator
@app.callback(
    dash.dependencies.Output('graph', 'figure'),
    [dash.dependencies.Input('test_dropdow1', 'value')]
)

# function to change above callback class decorator
def change_color(selected_color):
 updated_fig = go.Figure(data=[go.Scatter(
    x=[1, 2, 3, 4], y=[10, 11, 12, 13],
    mode='markers',
    marker=dict(
        color=[selected_color, selected_color, selected_color, selected_color],
        opacity=[1, 0.8, 0.6, 0.4],
        size=[40, 60, 80, 100],
     )
 )])

 return updated_fig


if __name__ == '__main__':
    app.run_server(8051,debug=False)
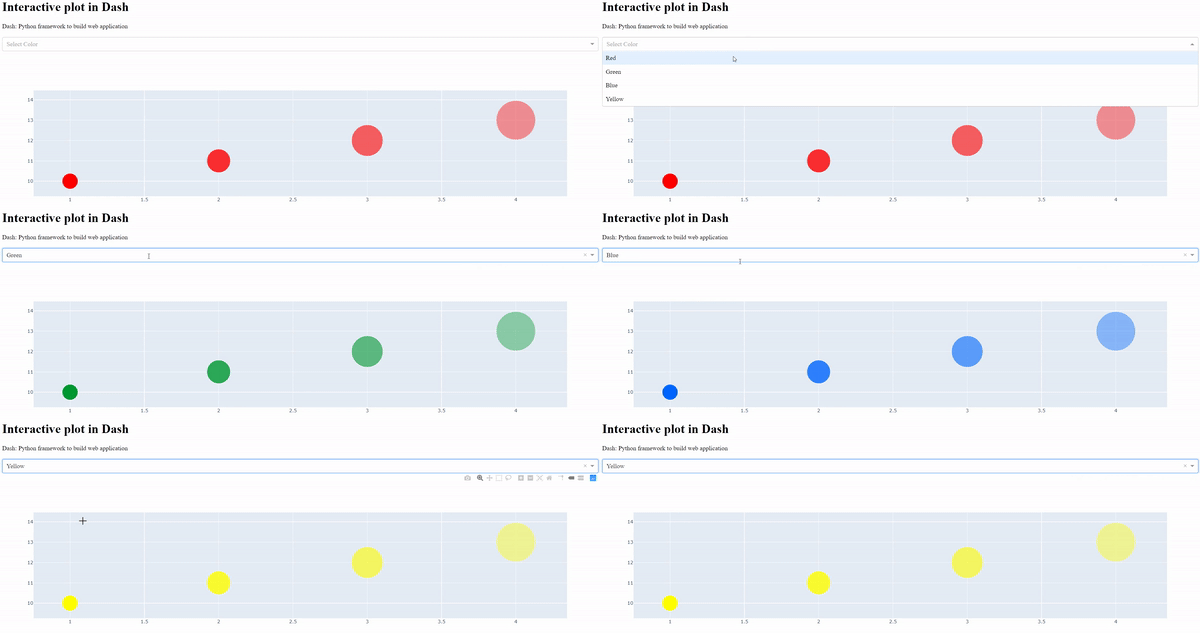
In above code I am changing colour of scatter dot by using callback function.
The color of scatter plot will change by selecting colour from dropdown box.
So in callback class decoder input will be dropdown box and output will be scatter plot.
Now let’s see the output
Use multiple callback functions in Dash
To handle multiple interactions you need multiple callback function inside dash application. Each callback block (callback class decoder and callback update function) can be written one by one to have multiple interactions.
Must Read: Learn Dash with Python in 5 minutes
Must Read: Learn Dash with Python in 5 minutes
Conclusion
In this post you learned below points in a basic level. I tried to make this post and last post as simple as possible so that you can learn dash with python by spending minimum amount of time.
- How to use plotly code inside dash application
- How to make interactive dashboard in dash with python
- How to use multiple callback function in dash with python
If you have any question or suggestion regarding this topic see you in comment section. I will try my best to answer.


