In my pas few tutorial you I have shown how to learn Dash within no times. In this tutorial I will concentrate on how to plot lat long in map by using dash with python. Plotting lat long into map is called scatter plot on map (plotly term).
Now there are several ways to plot lat long value into map in plotly Dash. I am mentioning some popular one below.
· Mapbox
· Open Street Map
· USGS
Now for this tutorial I will walk you through Mapbox and Open Street Map as those two are most popular type of maps in plotly dash.
Also Read:
Plot lat long using Mapbox Maps in Dash Python
Mapbox is a tile based map. To use Mapbox map with Plotly you need a Mapbox account and a public Mapbox Access Token. This is not completely free api but you can use this api freely at some extend (will explain it).
So let’s create free Mapbox access token to use it.
Steps are as follows:
1. Go to https://www.mapbox.com/
2. Click on Sign in if you already have an Mapbox account else click on Sign up (Start mapping for free)
3. Once you signed in to your Mapbox account, Go to Account section of your profile

4. Now in your account section you can find your Access token

Now as you have your Mapbox access token with you, let’s try to plot some lat long value into map using Mapbox in Dash with Python and off course by using your own Mapbox access token.
import dash
import dash_core_components as dcc
import dash_html_components as html
import pandas as pd
import numpy as np

import dash_table

df = pd.read_csv('https://raw.githubusercontent.com/plotly/datasets/master/2011_february_us_airport_traffic.csv')

# Subset dataframe to show some specific columns in dash web app
df1 = df[['city','state','country','lat','long','cnt']]

app = dash.Dash(external_stylesheets=['https://codepen.io/amyoshino/pen/jzXypZ.css'])

app.title = 'MapBox Map'

# API keys and datasets
mapbox_access_token = 'Paste your Mapbox Access token here inside qutation'

# Find Lat Long center
lat_center = sum(df['lat'])/len(df['lat'])
long_center = sum(df['long'])/len(df['long'])

layout_map = dict(
    autosize=True,
    height=500,
    weidth=100,
    font=dict(color="#191A1A"),
    titlefont=dict(color="#191A1A", size='14'),
    margin=dict(
        l=0,
        r=0,
        b=0,
        t=0
    ),
    hovermode="closest",
    plot_bgcolor='#fffcfc',
    paper_bgcolor='#fffcfc',
    legend=dict(font=dict(size=10), orientation='h'),
    mapbox=dict(
        accesstoken=mapbox_access_token,
        style="outdoors",
        center=dict(
            lon = long_center,
            lat = lat_center
        ),
        zoom=2,
    )
)

app.layout = html.Div(
    html.Div([
        html.Div([
            html.H1(children='Plot Lat Long using Mapbox in Dash'),

            html.H6(children='''
                Plotting all airports in map using respective lat long value
            '''),
   html.Div(id='my-div'),
        ], className = 'row'),

        html.Br(),

        html.Div([
            html.Div([
        dash_table.DataTable(
                        id='table',
                        columns=[{"name": i, "id": i} for i in df1.columns],
                        data=df1.loc[:14,].to_dict('records'),
                    ),
            ], className = 'six columns'),


            html.Div([
    dcc.Graph(
     id='MapPlot',
      figure={
       "data": [{
        "type": "scattermapbox",
        "lat": list(df.lat),
        "lon": list(df.long),
        "hoverinfo": "text",
        "hovertext": [["Lat: {}
Long: {}
Count: {}".format(i,j,k)]
            for i,j,k in zip(df['lat'], df['long'],df['cnt'])],
        "mode": "markers",
        "name": list(df['state']),
        "marker": {
         "size": 15,
         "opacity": 0.7,
         "color": '#F70F0F'
        }
       }],
       "layout": layout_map
      }
    ),
            ], className = 'six columns')
        ], className = 'row')

    ])
)

if __name__ == '__main__':
    app.run_server(debug=False)

Now for this tutorial I have used ‘outdoors’ style (style=”outdoors”) but there are different types of styles available for Mapbox, which you can also try.
Different styles in Mapbox: “basic”, “streets”, “outdoors”, “light”, “dark”, “satellite”, “satellite-streets” etc.
As we are using free token of Mapbox we should know limitations of Mapbox.
Limitation of Mapbox free token
There are few limitations of free Mapbox access token.
1. If you are using mapboxmap in Web Application then up to 50,000 times you can call free mapbox token
2. For Mobile Application up to 25,000 times you can call free mapbox token
For more details visit: https://www.mapbox.com/pricing/

Now let’s try to do same thing by another type of map in plotly dash which is Open Street Map.
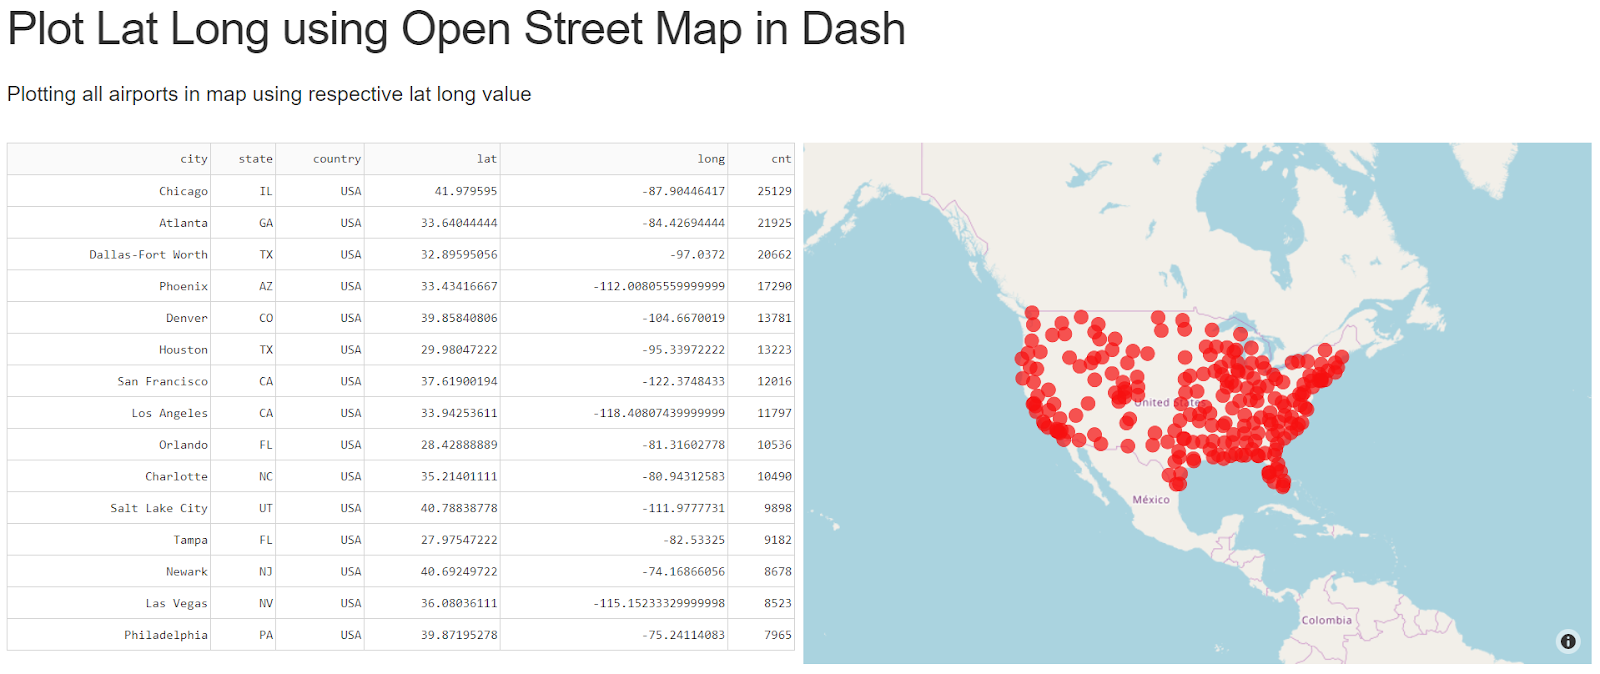
Plot lat long using Open Street Map Maps in Dash Python
Open Street Map is a project to create a free editable map of the world. You can use Open Street Maps tiles in plotly dash with python and it is completely open source. No Access token is needed for Open Street Map.
import dash
import dash_core_components as dcc
import dash_html_components as html
import pandas as pd
import numpy as np
import dash_table


df = pd.read_csv('https://raw.githubusercontent.com/plotly/datasets/master/2011_february_us_airport_traffic.csv')

# Subset dataframe to show some specific columns in dash web app
df1 = df[['city','state','country','lat','long','cnt']]

# Find Lat Long center
lat_center = sum(df['lat'])/len(df['lat'])
long_center = sum(df['long'])/len(df['long'])

# Find Lat Long center
lat_center = sum(df['lat'])/len(df['lat'])
long_center = sum(df['long'])/len(df['long'])

app = dash.Dash(external_stylesheets=['https://codepen.io/amyoshino/pen/jzXypZ.css'])
app.title = 'Open Street Map'

layout_map = dict(
    autosize=True,
    height=500,
    weidth=100,
    font=dict(color="#191A1A"),
    titlefont=dict(color="#191A1A", size='14'),
    margin=dict(
        l=0,
        r=0,
        b=0,
        t=0
    ),
    hovermode="closest",
    plot_bgcolor='#fffcfc',
    paper_bgcolor='#fffcfc',
    legend=dict(font=dict(size=10), orientation='h'),
    mapbox=dict(
        style="open-street-map",
        center=dict(
            lon = long_center,
            lat = lat_center
        ),
        zoom=2,
    )
)

app.layout = html.Div(
    html.Div([
        html.Div([
            html.H1(children='Plot Lat Long using Open Street Map in Dash'),

            html.H6(children='''
                Plotting all airports in map using respective lat long value
            '''),
   html.Div(id='my-div'),
        ], className = 'row'),

        html.Br(),

        html.Div([
            html.Div([
        dash_table.DataTable(
                        id='table',
                        columns=[{"name": i, "id": i} for i in df1.columns],
                        data=df1.loc[:14,].to_dict('records'),
                    ),
            ], className = 'six columns'),


            html.Div([
    dcc.Graph(
     id='MapPlot',
      figure={
       "data": [{
        "type": "scattermapbox",
        "lat": list(df.lat),
        "lon": list(df.long),
        "hoverinfo": "text",
        "hovertext": [["Lat: {}
Long: {}
Count: {}".format(i,j,k)]
            for i,j,k in zip(df['lat'], df['long'],df['cnt'])],
        "mode": "markers",
        "name": list(df['state']),
        "marker": {
         "size": 15,
         "opacity": 0.7,
         "color": '#F70F0F'
        }
       }],
       "layout": layout_map
      }
    ),
            ], className = 'six columns')
        ], className = 'row')

    ])
)

if __name__ == '__main__':
    app.run_server(debug=True)
Mapbox Map vs Open Street Map
As you can see both results are almost same. Both maps have some pros and cons .
Mapbox Pros
Different kind of styles you can use based on your choice
You can also create your own style from Mapbox Studio
Mapbox Cons
It is not completely open source. There are some limitations in terms of usage
Open Street Map Pros
· Completely open source
· There is no limitation in terms of usage
Open Street Map Cons
· You can only use one default style
Also Read:
Conclusion
In this post I have shown
- How to plot lat long using Mapbox with Dash Python
- Limitation of Mapbox Api
- How to create Mapbox Access token
- How to plot lat long using Open Street Map with Dash Python
If you have any question or suggestion regarding this topic see you in comment section. I will try my best to answer.
This is my first time I have visited your site. I found a lot of interesting stuff in your blog. From the tons of comments on your posts, I guess I am not the only one! keep up the great work.
Perfect piece of work you have done, this website is really cool with great info .
Fantastic job here. I definitely enjoyed what you had to say. Keep going because you absolutely bring a new voice to this subject. Not many people would say what youve said and still make it interesting. Well, at least Im interested. Cant wait to see more of this from you.
Hello 🙂 Your post is very brilliant and fascinated, I like the idea. I refer main address for all friends Thanks!
Great goods from you, man. I’ve understand your stuff previous to and you’re just extremely wonderful.
I really like what you’ve got right here, certainly like what you are stating and the way in which by which you say it.
You are making it entertaining and you continue to care for to stay it
sensible. I cant wait to learn far more from you. This is actually a great site.